We can view what MIB/OID information is available to pull via SNMP by running the below command.
[root@localhost objects]# snmpwalk -c public -v 2c 192.168.1.21 1.3.6.1.4.1
Information we can pull into Nagios via the check_snmp service is shown.
[root@localhost objects]# snmpwalk -c public -v 2c 192.168.1.21 1.3.6.1.4.1
SNMPv2-SMI::enterprises.39165.1.1.0 = STRING: "DS-2CD2365G1-I"
SNMPv2-SMI::enterprises.39165.1.2.0 = STRING: "0"
SNMPv2-SMI::enterprises.39165.1.3.0 = STRING: "V5.5.83 build 190221"
SNMPv2-SMI::enterprises.39165.1.4.0 = STRING: "68-6d-bc-20-a3-28"
SNMPv2-SMI::enterprises.39165.1.5.0 = STRING: "88"
SNMPv2-SMI::enterprises.39165.1.6.0 = STRING: "Hikvision"
SNMPv2-SMI::enterprises.39165.1.7.0 = STRING: "75 PERCENT"
SNMPv2-SMI::enterprises.39165.1.8.0 = STRING: "218.6 GB"
SNMPv2-SMI::enterprises.39165.1.9.0 = STRING: "27 PERCENT"
SNMPv2-SMI::enterprises.39165.1.10.0 = STRING: "512 MB"
SNMPv2-SMI::enterprises.39165.1.11.0 = STRING: "98 PERCENT"
SNMPv2-SMI::enterprises.39165.1.12.0 = INTEGER: 0
SNMPv2-SMI::enterprises.39165.1.13.0 = IpAddress: 192.168.1.21
SNMPv2-SMI::enterprises.39165.1.14.0 = IpAddress: 255.255.255.0
SNMPv2-SMI::enterprises.39165.1.15.0 = IpAddress: 192.168.1.1
SNMPv2-SMI::enterprises.39165.1.16.0 = IpAddress: 0.0.0.0
SNMPv2-SMI::enterprises.39165.1.17.0 = IpAddress: 0.0.0.0
SNMPv2-SMI::enterprises.39165.1.18.0 = IpAddress: 0.0.0.0
SNMPv2-SMI::enterprises.39165.1.19.0 = STRING: "2019-12-18 18:49:20"
SNMPv2-SMI::enterprises.39165.1.20.0 = INTEGER: 1
SNMPv2-SMI::enterprises.39165.1.21.0 = STRING: "H.265"
SNMPv2-SMI::enterprises.39165.1.22.0 = STRING: "H.264"
SNMPv2-SMI::enterprises.39165.1.23.0 = INTEGER: 0
SNMPv2-SMI::enterprises.39165.1.24.0 = INTEGER: 0
SNMPv2-SMI::enterprises.39165.1.25.0 = INTEGER: 0
SNMPv2-SMI::enterprises.39165.1.26.0 = INTEGER: 1
SNMPv2-SMI::enterprises.39165.1.27.0 = INTEGER: 1
SNMPv2-SMI::enterprises.39165.1.28.0 = INTEGER: 1
SNMPv2-SMI::enterprises.39165.1.29.0 = STRING: "ETHERNET"
SNMPv2-SMI::enterprises.39165.1.30.0 = INTEGER: 0
SNMPv2-SMI::enterprises.39165.1.31.0 = INTEGER: 0
SNMPv2-SMI::enterprises.39165.1.32.0 = IpAddress: 0.0.0.0
SNMPv2-SMI::enterprises.39165.1.33.0 = ""
SNMPv2-SMI::enterprises.39165.1.34.0 = INTEGER: 0
SNMPv2-SMI::enterprises.39165.1.34.0 = No more variables left in this MIB View (It is past the end of the MIB tree)
Lets change to our libexec folder to confirm results before adding a new host.
/usr/local/nagios/libexec
We can run the below command to verify we are getting the correct MIB/OID information. In this example i am requesting information from the enterprises.39165.1.13.0 OID.
./check_snmp 192.168.1.21 -C public -o .enterprises.39165.1.13.0  -P 1
SNMP OK - IpAddress: 192.168.1.21 |
The IP address of my CCTV camera is verified.
Next we need to define the host lets create a new host in our objects directory.
/usr/local/nagios/etc/objects
define host {
 use linux-server
 host_name hikvision
 alias Hikvision
 notes Hikvision
 address 192.168.1.21
 }


define service {
 use generic-service
 host_name hikvision
 service_description Ip Address
 check_command check_snmp! -C public -o .enterprises.39165.1.13.0 -P 1
}
We then need to add our host to our nagios.cfg file
/usr/local/nagios/etc/

cfg_file=/usr/local/nagios/etc/objects/mikrotik.cfg
cfg_file=/usr/local/nagios/etc/objects/hikvision.cfg
Lets verify our config before restarting nagios to avoid errors. All looks GOOD !
[root@localhost objects]# /usr/local/nagios/bin/nagios -v /usr/local/nagios/etc/nagios.cfg

Nagios Core 4.4.5
Copyright (c) 2009-present Nagios Core Development Team and Community Contributors
Copyright (c) 1999-2009 Ethan Galstad
Last Modified: 2019-08-20
License: GPL

Website: https://www.nagios.org
Reading configuration data...
   Read main config file okay...
   Read object config files okay...

Running pre-flight check on configuration data...

Checking objects...
        Checked 50 services.
        Checked 9 hosts.
        Checked 7 host groups.
        Checked 5 service groups.
        Checked 1 contacts.
        Checked 1 contact groups.
        Checked 26 commands.
        Checked 5 time periods.
        Checked 0 host escalations.
        Checked 0 service escalations.
Checking for circular paths...
        Checked 9 hosts
        Checked 0 service dependencies
        Checked 0 host dependencies
        Checked 5 timeperiods
Checking global event handlers...
Checking obsessive compulsive processor commands...
Checking misc settings...

Total Warnings: 0
Total Errors:   0

Things look okay - No serious problems were detected during the pre-flight check
service nagios reload
Lets run a quick status check
[root@localhost objects]# service nagios status
Redirecting to /bin/systemctl status nagios.service
● nagios.service - Nagios Core 4.4.5
   Loaded: loaded (/usr/lib/systemd/system/nagios.service; enabled; vendor preset: disabled)
   Active: active (running) since Mon 2019-12-16 12:01:34 EST; 2 days ago
     Docs: https://www.nagios.org/documentation
  Process: 25153 ExecReload=/usr/bin/kill -s HUP ${MAINPID} (code=exited, status=0/SUCCESS)
 Main PID: 4040 (nagios)
    Tasks: 6 (limit: 11512)
   Memory: 28.5M
   CGroup: /system.slice/nagios.service
           ├─ 4040 /usr/local/nagios/bin/nagios -d /usr/local/nagios/etc/nagios.cfg
           ├─ 4045 /usr/local/nagios/bin/nagios -d /usr/local/nagios/etc/nagios.cfg
           ├─25154 /usr/local/nagios/bin/nagios --worker /usr/local/nagios/var/rw/nagios.qh
           ├─25155 /usr/local/nagios/bin/nagios --worker /usr/local/nagios/var/rw/nagios.qh
           ├─25156 /usr/local/nagios/bin/nagios --worker /usr/local/nagios/var/rw/nagios.qh
           └─25157 /usr/local/nagios/bin/nagios --worker /usr/local/nagios/var/rw/nagios.qh

Dec 18 13:49:09 localhost.localdomain nagios[4040]: SERVICE FLAPPING ALERT: pi_livingroom;PING;STARTED; Service appea>
Dec 18 13:49:40 localhost.localdomain nagios[25154]: job 0 (pid=25158): read() returned error 11
Dec 18 13:49:40 localhost.localdomain nagios[4040]: wproc: Core Worker 25154: job 0 (pid=25158) timed out. Killing it
Dec 18 13:49:40 localhost.localdomain nagios[4040]: wproc: CHECK job 0 from worker Core Worker 25154 timed out after >
Dec 18 13:49:40 localhost.localdomain nagios[4040]: wproc:   host=pi_livingroom; service=(null);
Dec 18 13:49:40 localhost.localdomain nagios[4040]: wproc:   early_timeout=1; exited_ok=0; wait_status=0; error_code=>
Dec 18 13:49:40 localhost.localdomain nagios[4040]: Warning: Check of host 'pi_livingroom' timed out after 30.01 seco>
Dec 18 13:49:40 localhost.localdomain nagios[4040]: HOST ALERT: pi_livingroom;DOWN;SOFT;1;(Host check timed out after>
Dec 18 13:49:40 localhost.localdomain nagios[4040]: wproc: Core Worker 25154: job 0 (pid=25158): Dormant child reaped
Dec 18 13:50:41 localhost.localdomain nagios[4040]: HOST ALERT: pi_livingroom;UP;SOFT;1;PING OK - Packet loss = 0%, R>
lines 1-26/26 (END)...skipping...
● nagios.service - Nagios Core 4.4.5
   Loaded: loaded (/usr/lib/systemd/system/nagios.service; enabled; vendor preset: disabled)
   Active: active (running) since Mon 2019-12-16 12:01:34 EST; 2 days ago
     Docs: https://www.nagios.org/documentation
  Process: 25153 ExecReload=/usr/bin/kill -s HUP ${MAINPID} (code=exited, status=0/SUCCESS)
 Main PID: 4040 (nagios)
    Tasks: 6 (limit: 11512)
   Memory: 28.5M
   CGroup: /system.slice/nagios.service
           ├─ 4040 /usr/local/nagios/bin/nagios -d /usr/local/nagios/etc/nagios.cfg
           ├─ 4045 /usr/local/nagios/bin/nagios -d /usr/local/nagios/etc/nagios.cfg
           ├─25154 /usr/local/nagios/bin/nagios --worker /usr/local/nagios/var/rw/nagios.qh
           ├─25155 /usr/local/nagios/bin/nagios --worker /usr/local/nagios/var/rw/nagios.qh
           ├─25156 /usr/local/nagios/bin/nagios --worker /usr/local/nagios/var/rw/nagios.qh
           └─25157 /usr/local/nagios/bin/nagios --worker /usr/local/nagios/var/rw/nagios.qh

Dec 18 13:49:09 localhost.localdomain nagios[4040]: SERVICE FLAPPING ALERT: pi_livingroom;PING;STARTED; Service appears to have started flapping (26.>
Dec 18 13:49:40 localhost.localdomain nagios[25154]: job 0 (pid=25158): read() returned error 11
Dec 18 13:49:40 localhost.localdomain nagios[4040]: wproc: Core Worker 25154: job 0 (pid=25158) timed out. Killing it
Dec 18 13:49:40 localhost.localdomain nagios[4040]: wproc: CHECK job 0 from worker Core Worker 25154 timed out after 30.01s
Dec 18 13:49:40 localhost.localdomain nagios[4040]: wproc:   host=pi_livingroom; service=(null);
Dec 18 13:49:40 localhost.localdomain nagios[4040]: wproc:   early_timeout=1; exited_ok=0; wait_status=0; error_code=62;
Dec 18 13:49:40 localhost.localdomain nagios[4040]: Warning: Check of host 'pi_livingroom' timed out after 30.01 seconds
Dec 18 13:49:40 localhost.localdomain nagios[4040]: HOST ALERT: pi_livingroom;DOWN;SOFT;1;(Host check timed out after 30.01 seconds)
Dec 18 13:49:40 localhost.localdomain nagios[4040]: wproc: Core Worker 25154: job 0 (pid=25158): Dormant child reaped
Dec 18 13:50:41 localhost.localdomain nagios[4040]: HOST ALERT: pi_livingroom;UP;SOFT;1;PING OK - Packet loss = 0%, RTA = 0.66 ms
~
Looks like my PI might have a power issue, this may explain why i have had SD card corruption issues
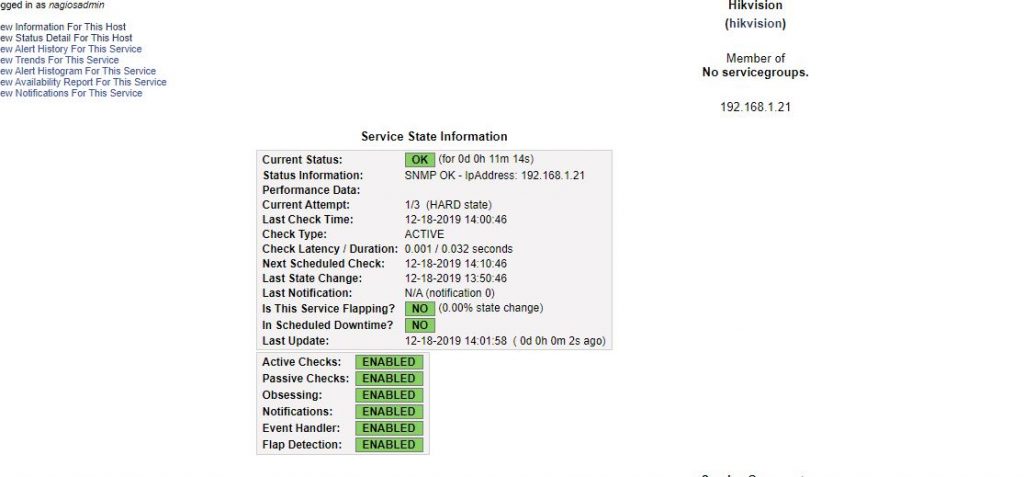
We can see below that the host is up and we are successfully monitoring, our camera.