I have been moving my Zabbix Monitoring system over to Nagios Core, running on Centos 8 within a ESXI host on a Dell T310 server.
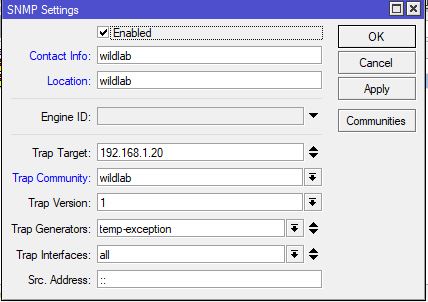
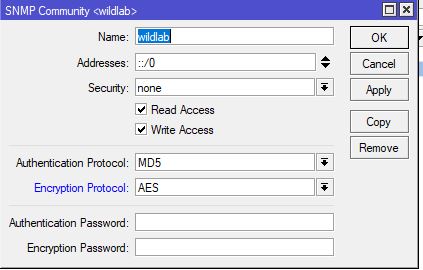
First of all we need to enable SNMP on the Mikrotik Router and add the relevant SNMP firewall rule.
Follow this guide, adjusting the commands to your own environment.
/snmp community add name=wildlab read-access=yes write-access=no authentication-protocol=MD5 authentication-password=mypass encryption-protocol=AES encryption-password=mypass security=private/snmp set contact="wildlabs" location="wildlab" enabled=yesAfter running the below commands we can confirm, by viewing the results in the GUI using Winbox. IP > SNMP


Mikrotik Firewall Rules
We need to add the ports for SNMP to the Firewall .
/ip-firewall filter
add chain=input dst-port=161 protocol=udp action=accept
Lets perform a test from our Centos 8 server to confirm SNMP on our Mikrotik Router is active
snmpwalk -c public -v 2c 192.168.1.1We should see some MIB and O.I.D information output in our terminal, below is an example of what you may see.
IF
IF-MIB::ifIndex.32 = INTEGER: 32
IF-MIB::ifIndex.33 = INTEGER: 33
IF-MIB::ifDescr.1 = STRING: sfp1
IF-MIB::ifDescr.2 = STRING: ether1_WAN
IF-MIB::ifDescr.3 = STRING: ether2-master
IF-MIB::ifDescr.4 = STRING: ether3
IF-MIB::ifDescr.5 = STRING: ether4
IF-MIB::ifDescr.6 = STRING: ether5
IF-MIB::ifDescr.7 = STRING: ether6-master
IF-MIB::ifDescr.8 = STRING: ether7
IF-MIB::ifDescr.9 = STRING: ether8
IF-MIB::ifDescr.10 = STRING: ether9
IF-MIB::ifDescr.11 = STRING: ether10
IF-MIB::ifDescr.12 = STRING: wlan1
IF-MIB::ifDescr.13 = STRING: bridge_lan
IF-MIB::ifDescr.14 = STRING: pppoe-out1
Nagios Configuration
For the purposes of this exercise i want to monitor the below
- Uptime
- DHCP Leases
- Probably a lot more 😛
Before i configure Nagios i need to know which O.I.D i want to pull information from for monitoring purposes.
http://www.mibdepot.com/ or http://oid-info.com/ is a great resource to help out with this.
*The OID i will be using for UPtime is*

1.3.6.1.2.1.1.3.0

{iso(1) identified-organization(3) dod(6) internet(1) mgmt(2) mib-2(1) system(1) sysUpTime(3) sysUpTimeInstance(0)}
"The OID for the Number of DHCP Leases is*

1.3.6.1.4.1.14988.1.1.6.1.0

 1.3.6.1.4.1.14988.1.1.6.1.0
-- iso(1). org(3). dod(6). internet(1). private(4). enterprises(1). mikrotik(14988). mikrotikExperimentalModule(1). mtXRouterOs(1). mtxrDHCP(6). mtxrDHCPLeaseCount(1). 0
 	SYNTAX	Gauge32
 	MAX-ACCESS	read-only
 	DESCRIPTION
We have the underlying information we want to monitor, now we need to tie it all together within Nagios.
We need to create a host this will contain information about our Mikrotik Router.
cd
/usr/local/nagios/etc/objects
nano mikrotik.cfgWe then need to define our host setting and check commands, for this i am using the “check_snmp” module.
define host {
 use linux-server
 host_name Mikrotik-Router
 alias Mikrotik Router
 notes Mikrotik Router
 address 192.168.1.1
 }


define service {
 use generic-service
 host_name Mikrotik-Router
 service_description Uptime
 check_command check_snmp! -C public -o 1.3.6.1.2.1.1.3.0 -P 1
}

define service {
 use generic-service
 host_name Mikrotik-Router
 service_description DHCP Lease Count
 check_command check_snmp! -C public -o 1.3.6.1.4.1.14988.1.1.6.1.0 -P 1
}
You will see in the above we are using the check_snmp module, this module will now check the defined host 192.168.1.1 via snmp walk and will display service information within our Zenoss server.

Verifying Results
Whats the good in monitoring if the results we are getting are not correct ? Lets run a quick test to verify we are pulling the correct O.I.D information.
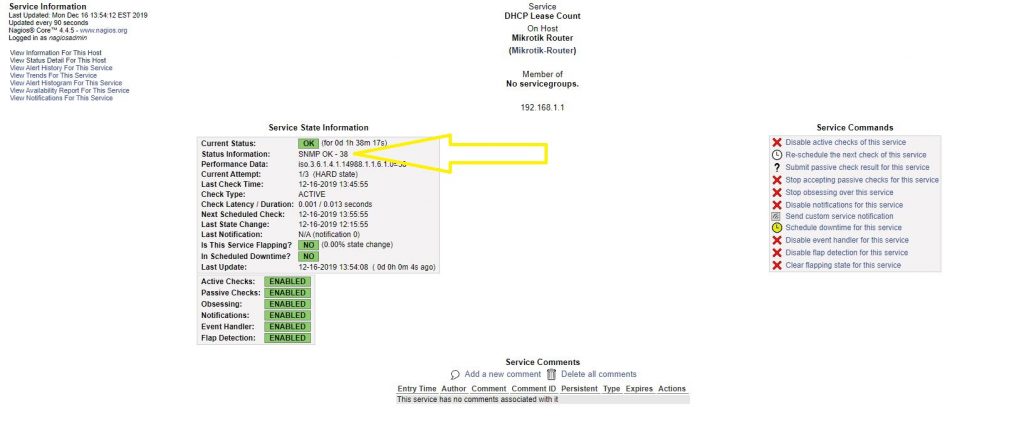
In this example we monitored DHCP leases via Nagios.
Nagios is reporting 38 DHCP leases, now lets verify this at the source THE Mikrotik router

38 DHCP leases

We have now confirmed that we are monitoring correctly i will soon add other SNMP monitoring from my Mikrotik router.
