Everything in this quick tutorial has been done using Centos 8. I am sure if you are here you are already aware of what Nagios is.
Nagios is a performance monitoring tool, that can we used for network and endpoint monitoring, it can monitor many devices and allows us to monitor devices on our network. What nagios of capable of monitoring can be found on the Nagios website. In this post we will be setting up and monitoring a Cisco 3560 series switch.
Head over to https://exchange.nagios.org and download “check_cisco.pl” and “check_cisco_switch.pl”
Add these files to the below directory making sure you give them relevant file permissions.
/usr/local/nagios/libexec
chmod +x check_cisco_switch.pl
chmod +x check_cisco.pl
Next we install the prerequisites
cd /usr/local/nagios/libexec
yum -y install perl-Net-SNMP
chmod +x check_cisco_switch.pl
If this step errors, you will need to enable Power-Tools as below
sudo yum config-manager --enable --powertoolsConfigure the Cisco 3560 for SNMP
enable
config t
ip access-list standard ACL-SNMP
     permit 192.168.1.23
snmp-server community T@s9aMon RO ACL-SNMP
snmp-server wildlab
snmp-server contact wildlab@wildlab.co.uk
Copy running-config startup-config
Next within Nagios we can perform a SNMP walk to verify the steps above, this will allow us to view the MIB information for the device.
snmpwalk -v2c -c T@s9aMon 192.168.1.23

Before we move on lets run a quick test with the plugin that we have just added to check on the cisco switch, open up your centos terminal, making sure you are in the libexec folder.
cd /usr/local.nagios/libexec
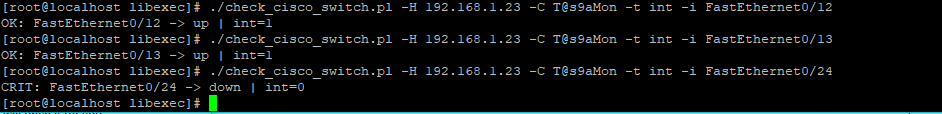
./check_cisco_switch.pl -H 192.168.1.23 -C T@s9aMon -t int -i FastEthernet0/12
--------------------------------------------------------------
OK: FastEthernet0/12 -> up | int=1
A successful result will look like the below
we can also run the below commands as a test, this will give us current memory used.
./check_cisco_switch.pl -H 192.168.1.23 -C T@s9aMon -t mem -w 50 -c 40

-----------------------------------------------------------
[root@localhost libexec]# ./check_cisco_switch.pl -H 192.168.1.23 -C T@s9aMon -t mem -w 50 -c 40
Memory: OK - Free Memory 74% | memory_total=87MB memory_used=21MB

Now we have the plugin working, it is now time to tie this all up within the Nagios application. Lets start by creating some groups, i like to seperate third party plugins and keep everything neat in my own folders.
cd /etc/local/nagios/
mkdir dean
cd /dean
mkdir commands
mkdir hostgroups
mkdir remotehosts
mkdir servicegroups
Next up we need to tell nagios about the new configuration directories.
cd /usr/local/nagios/etc
nano nagios.cfg

**add the below line**

# Dean Custom #
cfg_dir=/usr/local/nagios/etc/dean
Create a host group for our Cisco Switch
cd /etc/local/nagios/dean/hostgroups
nano cisco-switch.cfg
-----------------------------------------------------
define servicegroup{
 servicegroup_name memory-usage
 alias Cisco 3560 Lab Memory Usage
 }

define servicegroup{
 servicegroup_name cpu-usage
 alias Cisco 3560 Lab CPU Usage
 }

define servicegroup{
 servicegroup_name device-fan
 alias Cisco 3560 Lab Device Fan
 }

define servicegroup{
 servicegroup_name device-powersupply
 alias Cisco 3560 Lab Device Power Suply
 }

define servicegroup{
 servicegroup_name cisco-interfacestatus
 alias  Cisco 3560 Lab Interface Status
 }
Now we need to define which commands can be used with the “check_cisco.pl” and “check_cisco_switch.pl” plugins, next we create
cd/ usr/local/nagios/dean/remotehosts
define host{
use generic-switch
host_name Cisco 3560 Lab
alias Cisco 3560 Lab
address 192.168.1.23
hostgroups cisco-switches
}
define service{
use generic-service
host_name Cisco 3560 Lab
service_description PING
check_command check_ping!200.0,20%!600.0,60%
check_interval 5
retry_interval 1
}
define service{
use generic-service
host_name Cisco 3560 Lab
service_description Memory Usage
check_command check_cisco_switch!T@s9aMon!mem!50!40
servicegroups memory-usage
}
define service{
use generic-service
host_name Cisco 3560 Lab
service_description CPU Usage
check_command check_cisco_switch!T@s9aMon!cpu!60!70
servicegroups cpu-usage
}
define service{
use generic-service
host_name Cisco 3560 Lab
service_description Device Fan
check_command check_cisco_switch!T@s9aMon!fan
servicegroups device-fan
}
define service{
use generic-service
host_name Cisco 3560 Lab
service_description Device Power Suply
check_command check_cisco_switch!T@s9aMon!ps
servicegroups device-powersupply
}
define service{
use generic-service
host_name Cisco 3560 Lab
service_description Port Fa0/13
check_command check_cisco_int!T@s9aMon!Fa0/13
servicegroups cisco-interfacestatus
}
define service{
use generic-service
host_name Cisco 3560 Lab
service_description Port Fa0/12
check_command check_cisco_int!T@s9aMon!Fa0/12
servicegroups cisco-interfacestatus
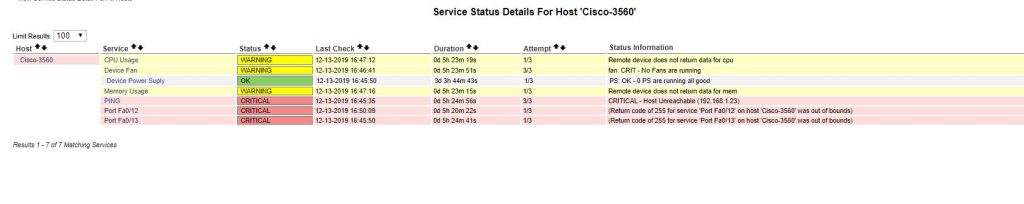
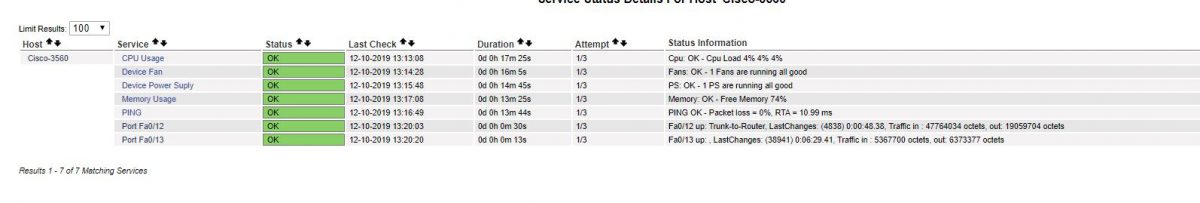
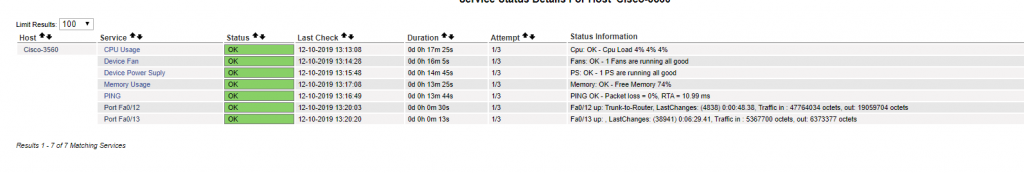
}service nagios reload. We will then see the host and services we added within Nagios

After a few mins we should see the interfaces we defined come online and status show as “OK”
Nagios Comms Error
A quick test i performed to confirm.