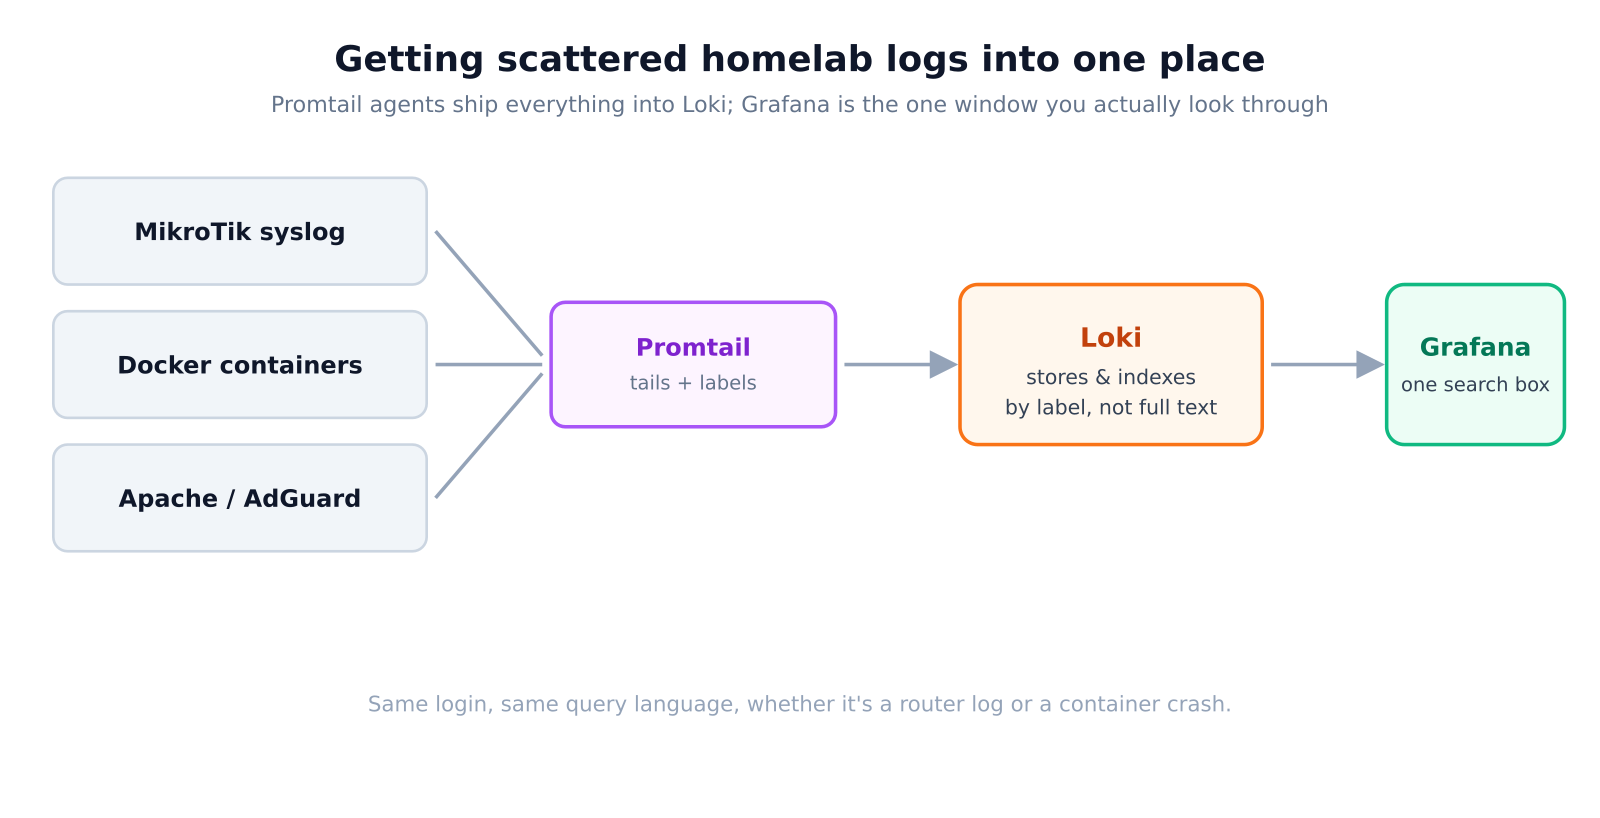
For years my “log aggregation strategy” was: SSH into whichever box was misbehaving, and grep around until something looked wrong. Router logs lived on the router. Docker logs lived in docker logs, one container at a time. Apache and AdGuard each had their own file, in their own format, in their own timezone quirks. It worked, technically, in the sense that I could always eventually find the line I needed — after enough coffee and enough terminal tabs.
What finally got me to stop doing that wasn’t a big outage. It was the small, stupid amount of time I kept losing just remembering which box had the log I wanted, before I’d even started debugging anything.
Why Loki specifically
There’s no shortage of log stacks — the classic ELK setup being the obvious alternative. I went with Grafana Loki for one practical reason: it indexes by label, not by full text. It doesn’t try to understand every line the way Elasticsearch does; it just tags each log stream with a few labels (host, container, job) and lets you grep within that stream on demand. For a homelab that means a fraction of the resource footprint, which matters a lot more on a small VPS or a Raspberry Pi than it does on a rack somewhere.
It also means one login. If you’re already running Grafana for your Prometheus metrics, logs show up as just another data source in the same UI, using the same query language shape (LogQL instead of PromQL, close enough that it doesn’t feel like learning a second tool).
The actual pieces
- Promtail — a small agent that tails files (or reads container logs, or receives syslog) and ships them to Loki with labels attached. One instance per host that has logs worth keeping.
- Loki — receives, indexes by label, and stores the raw log lines cheaply.
- Grafana — the window you actually look through. Add Loki as a data source and you can build a panel that shows metrics and logs side by side, on the same timeline.
The MikroTik piece is the fiddliest: routers don’t run Promtail, so the router ships syslog over the network to a small syslog-to-Loki relay instead. Everything else — Docker, Apache, AdGuard — has either a native Promtail scrape config or a log file Promtail can just tail directly.
What actually changed, day to day
The honest answer is: nothing got smarter, I just stopped context-switching. When a Grafana panel shows a spike, I can select that time range and see every log line from every source, in order, without opening a second terminal. The value isn’t some clever correlation engine — it’s that the logs are finally sitting right next to the graph that made me suspicious in the first place.
If you’ve already got Grafana and Prometheus running and you’re still SSH-ing around to grep log files by hand, Loki is a genuinely small amount of extra infrastructure for a disproportionately large drop in how annoying debugging feels.