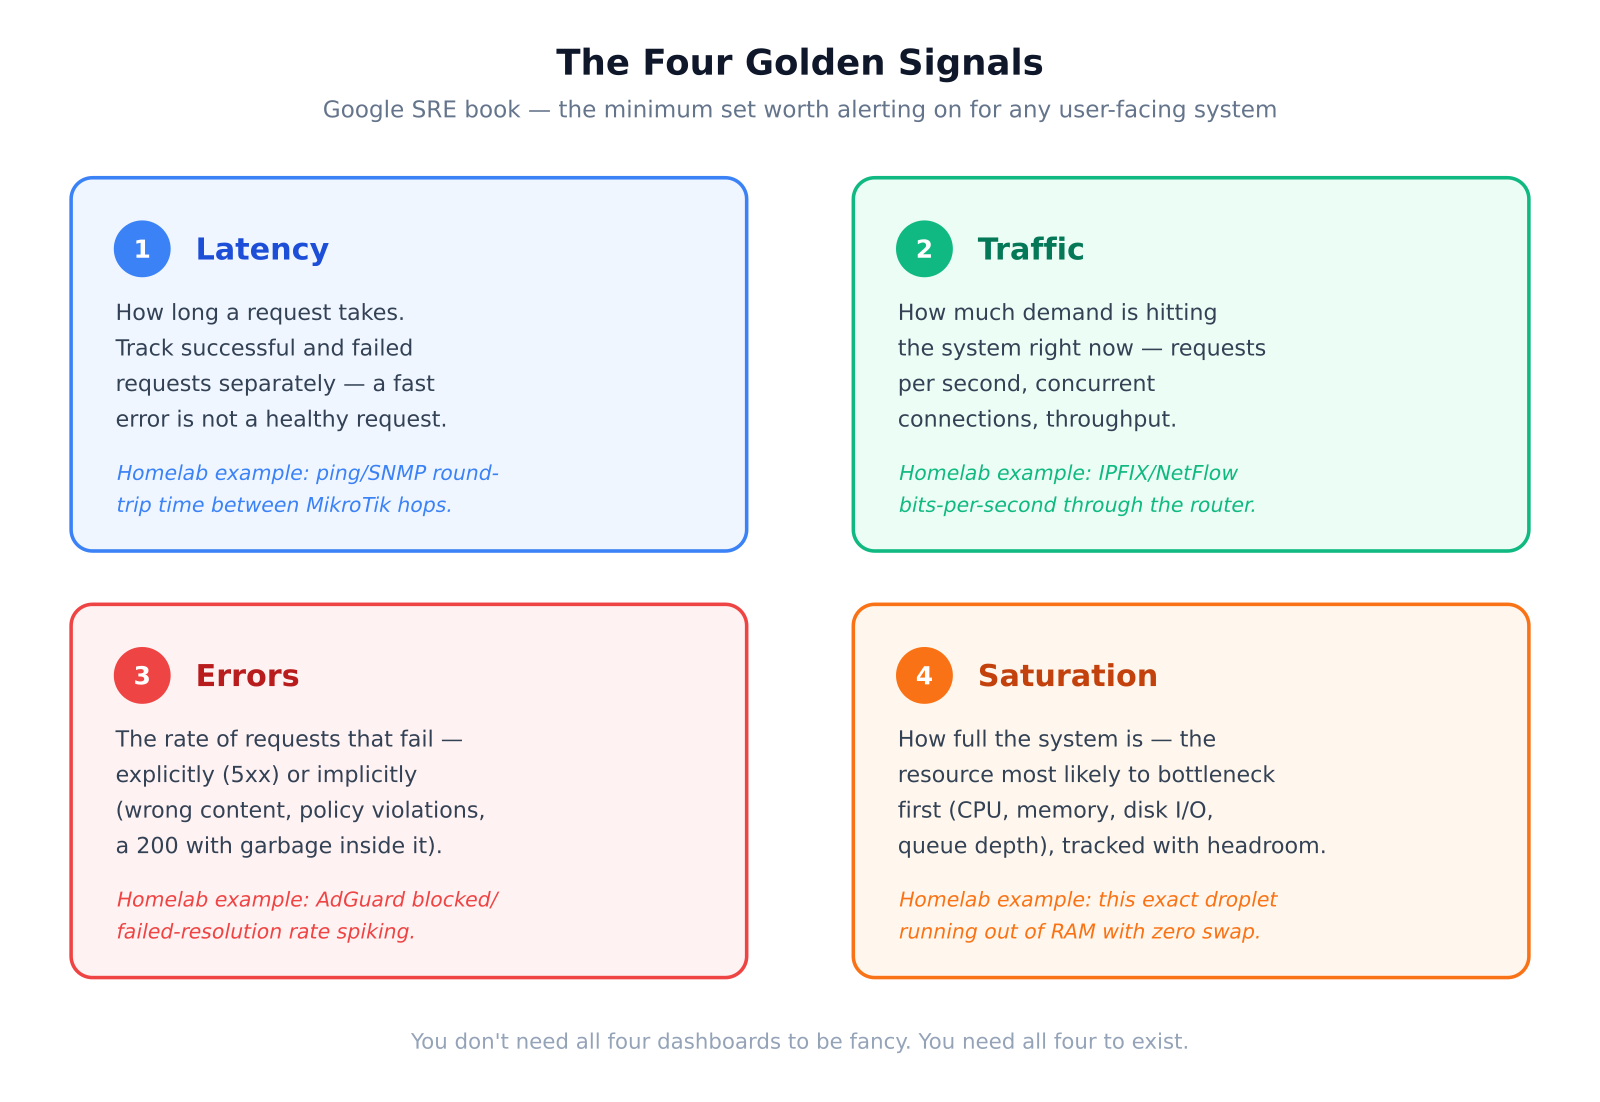
Google’s Site Reliability Engineering book devotes a section of its chapter on monitoring distributed systems to four signals it argues are the minimum set worth alerting on for almost any user-facing system: latency, traffic, errors, and saturation. It’s one of the most quoted ideas in the entire SRE canon, and also one of the most under-explained — most references to it stop at the four words, without getting into why those four, what they actually measure, or where the idea runs out of road.
This is the longer version: what each signal actually measures, the instrumentation choices that make them useful rather than misleading, the two adjacent frameworks worth knowing alongside this one, and the real limitations of the model.
1. Latency
Latency is how long a request takes — but the single most common mistake in implementing this signal is tracking only the average. Averages hide exactly the thing you care about: a system where 95% of requests return in 50ms and 5% take 8 seconds has a perfectly respectable-looking average, and a genuinely bad experience for one in twenty users. This is why latency is almost always tracked as a set of percentiles — p50 (median), p95, p99, sometimes p99.9 — rather than a single number. The tail percentiles matter disproportionately because, at any real scale, a “rare” 1%-of-requests problem still means a constant stream of bad experiences.
The second detail the SRE book is specific about: track successful and failed request latency separately. A request that fails fast — an immediate 500 because a dependency is down — will pull your overall average latency down, making a system in the middle of an outage look faster than normal on a latency-only dashboard. Blending the two numbers actively hides the problem you’re trying to detect.
Instrumentation-wise, this is what histogram metric types exist for — bucketing request durations so percentiles can be computed after the fact, rather than trying to track exact percentiles in real time (which is far more expensive and doesn’t aggregate cleanly across multiple instances).
2. Traffic
Traffic is demand: requests per second for an HTTP service, but the actual unit depends entirely on what the system does — messages per second for a queue, concurrent sessions for something stateful, transactions per second for a database, bits per second for a network link. There’s no universal unit; the right one is whatever correlates with the load the system is actually built to handle.
Traffic’s real importance is as the denominator for everything else. An error rate of “12 errors” means nothing without knowing whether that’s 12 out of 100 requests or 12 out of 2 million. A latency spike that coincides with a traffic spike is a capacity problem; the identical latency spike with flat traffic is something else entirely — a dependency degrading, a bad deploy, a lock contention issue. Traffic is the context that makes the other three signals interpretable rather than just alarming.
3. Errors
The obvious part: the rate of requests that explicitly fail — 5xx responses, thrown exceptions, timeouts. The less obvious and more important part: implicit errors — a 200 response with the wrong content in it, a silently truncated payload, a policy that fails open when it should fail closed, a cache serving stale data during an outage while every health check reports green. These don’t show up in a naive error-rate metric at all, because nothing in the request/response cycle flagged as an error — which is exactly why they’re dangerous, and why error detection has to include some notion of correctness, not just HTTP status codes.
This signal is also where the SRE book’s broader framework connects to SLOs and error budgets: once you’re tracking an error rate reliably, the natural next step is defining a Service Level Objective (say, 99.9% of requests succeed over a rolling 30 days) and treating the remaining 0.1% as an explicit, spendable error budget — a formal way of deciding how much unreliability is acceptable before it becomes the team’s top priority, rather than an implicit, never-discussed assumption.
4. Saturation
Saturation is the least intuitive of the four, and the one most often confused with a simpler concept: utilization. A CPU at 100% utilization is fully busy — but whether it’s saturated depends on whether work is now queueing up waiting for it. A resource can run at high utilization indefinitely with no ill effects if nothing is waiting; saturation specifically describes the point where demand exceeds capacity and a queue starts forming, which is the point where latency for new work starts climbing. This distinction — drawn from queueing theory, and central to Brendan Gregg’s USE method discussed below — is the difference between “busy but fine” and “about to get worse.”
The SRE book’s specific advice is to track saturation with headroom in mind — not “is it full” but “how long until it is,” which turns a lagging indicator (something already broke) into a leading one (something is about to). This is the signal most teams under-invest in, precisely because it rewards you before anything visibly breaks, which makes it easy to deprioritise until the day it would have mattered.
Two adjacent frameworks worth knowing
The Four Golden Signals didn’t emerge in isolation, and it’s worth knowing where it sits relative to two other well-known models, because each has a different natural fit:
- RED (Rate, Errors, Duration) — popularised by Weaveworks, this is essentially the request-centric half of the Golden Signals (traffic, errors, latency) without saturation, aimed specifically at request/response services. It’s simpler and often the right starting point for a single microservice.
- USE (Utilization, Saturation, Errors) — Brendan Gregg’s method, aimed the other direction: at resources rather than requests. CPU, disk, memory, network interfaces — each assessed for utilization, saturation, and errors. It’s the natural fit for infrastructure and host-level monitoring rather than application-level services.
The Four Golden Signals sits deliberately in the middle — borrowing the request-centric concerns from RED and the resource-centric concept of saturation from USE — which is a large part of why it generalises well across such different kinds of systems.
Where the model runs out of road
The four signals were framed around request/response systems, and they need real adaptation for anything shaped differently. A batch pipeline doesn’t have “latency” in the request sense — the equivalent is end-to-end job completion time against a deadline. An event-driven system’s “traffic” is arrival rate into a queue, and its most important saturation signal is often queue depth and consumer lag rather than CPU. None of this breaks the framework, but applying it uncritically to a system that isn’t request-shaped produces metrics that technically exist but don’t actually mean anything useful.
More importantly, the four signals were never claimed to be a complete monitoring strategy — they’re explicitly a minimum. They say nothing about cost (a system can be fast, low-error, and well within capacity while quietly burning an unsustainable cloud bill), nothing about security signals, and nothing about data correctness beyond what falls under “errors.” Treating them as the finish line rather than the floor is the most common way teams end up under-monitored while believing the opposite.
What makes the framework durable, almost a decade after the book popularised it, isn’t that it’s complete — it’s that it’s a genuinely good floor. If a system has real, correctly-instrumented dashboards for all four, you can answer “is it slow, is it busy, is it broken, and is it about to run out of room” in under a minute, for almost anything you’ll ever be asked to operate. Everything past that is refinement, not foundation.