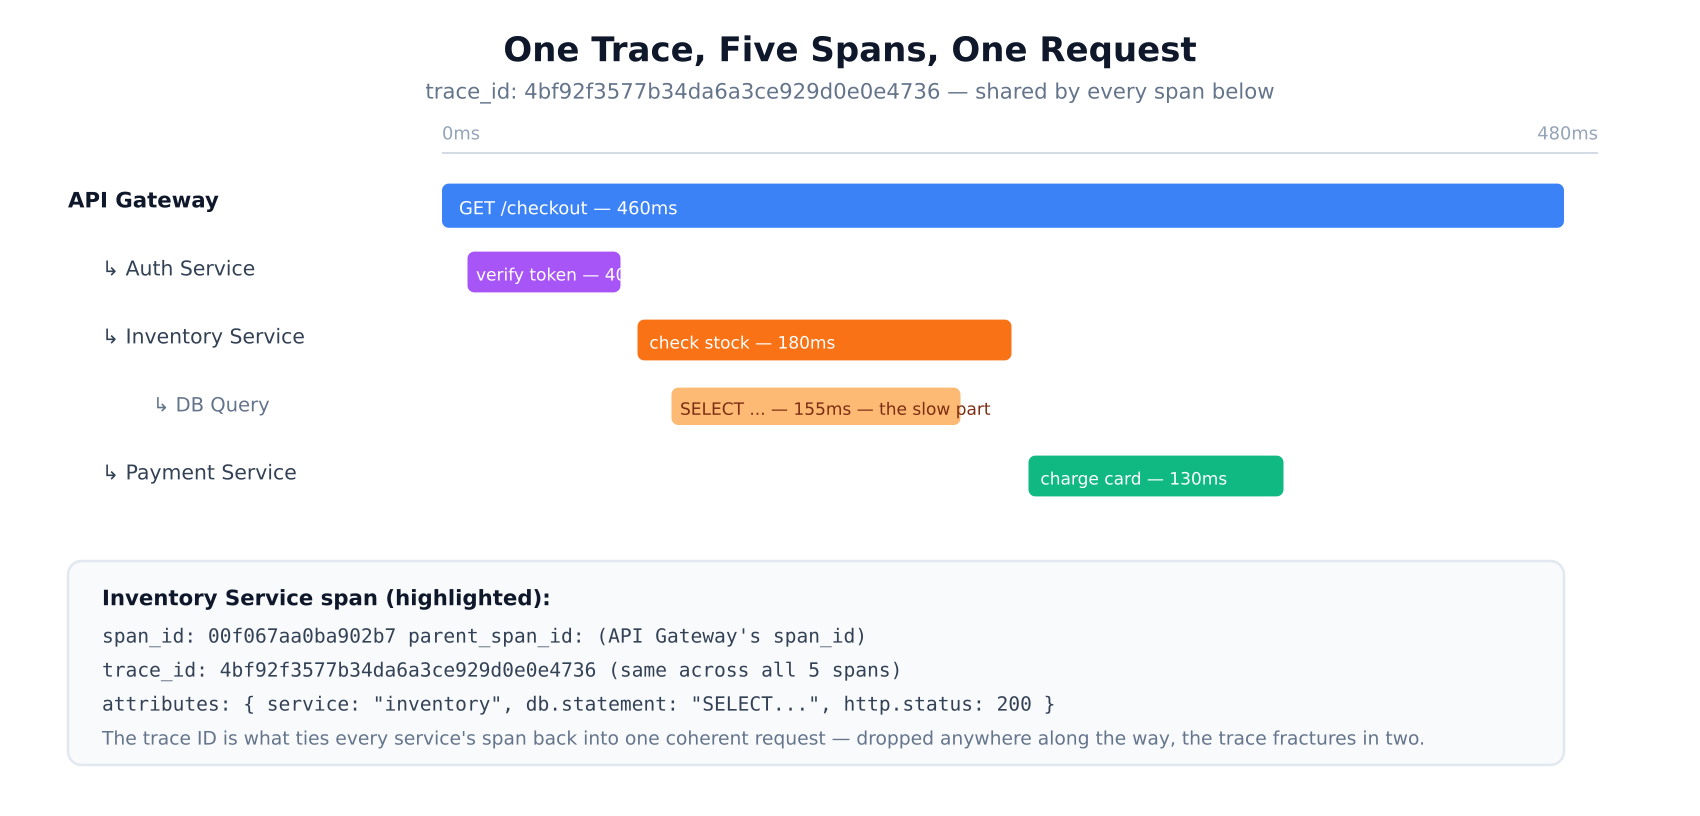
A single checkout button click can fan out across an API gateway, an auth check, an inventory lookup, a database query, and a payment call — five services, one user-perceived action. Logs from each service tell you what happened inside that one box. Metrics tell you the aggregate shape of traffic across all boxes. Neither tells you, for this specific request, which of those five hops actually ate the 460ms the user felt. That’s the specific gap distributed tracing exists to close.
Spans and traces, precisely
A span is one unit of work — a single service handling a single operation — recorded with a start time, a duration, a name, a set of attributes, and a status. A trace is the full set of spans generated by one end-to-end request, linked together into a tree by parent/child relationships: the API gateway’s span is the parent of the auth service’s span, which was called because of it. Every span in a trace shares the same trace ID — that shared ID is the entire mechanism that lets a tracing backend reassemble five independent services’ worth of logging into one coherent picture of a single request.
This is what a trace UI (Jaeger, Tempo, Zipkin) is actually showing you when you see the classic waterfall view: span duration as a horizontal bar, indented to show parent/child nesting, all sharing one time axis. The moment you can see that the Inventory Service’s database query alone accounted for a third of total request time, “where’s the latency coming from” stops being a guessing game across five sets of logs and becomes a single glance.
Context propagation — the part that actually breaks in practice
None of this works unless the trace ID and the calling span’s ID actually travel with the request from service to service. This is context propagation, and it’s standardised by W3C Trace Context as the traceparent HTTP header: version-traceid-spanid-flags, forwarded on every outbound call a service makes as part of handling an inbound one. Standardisation here matters more than it sounds — it’s specifically what lets a Java service, a Python service, and a Go service, each using different tracing libraries, still contribute spans to the same coherent trace.
In practice, this is also where traces most commonly break: any hop that doesn’t forward the incoming trace context starts a brand new, disconnected trace instead of continuing the existing one. The classic culprits are asynchronous boundaries — a message dropped onto a queue, a background job picked up later, a fire-and-forget call — where the trace context has to be explicitly carried in the message payload or queue headers, because there’s no HTTP request to attach a header to. Auto-instrumentation libraries handle the common synchronous cases (HTTP, gRPC) well; async boundaries are almost always the place that needs deliberate, manual propagation.
Sampling: you cannot keep every trace
Recording and storing every span of every request at real production volume is expensive, both in overhead on the services generating spans and in storage on the backend. Some form of sampling is close to universal, and the strategy you pick has real consequences for what you can actually see later.
- Head-based sampling — the decision to keep or discard a trace is made at the very start, typically a fixed probability (keep 1% of all traces). Simple, cheap, low overhead. The real weakness: the decision is made before anything interesting has happened, so a 1%-sampled system has a 99% chance of throwing away exactly the slow outlier or the request that hit an error — the traces you’d actually want to look at.
- Tail-based sampling — the decision is deferred until the whole trace has completed, so it can be based on what actually happened: keep it if it errored, keep it if it exceeded a latency threshold, otherwise sample normally. This directly solves head-based sampling’s weakness, at the cost of real complexity — every span has to be buffered somewhere until the trace is complete before a keep/discard decision can be made, which needs all of a trace’s spans routed through the same collection point within a bounded time window.
This is exactly where the OTel Collector’s tail_sampling processor earns its keep — it’s the piece that buffers spans, waits for a trace to complete or hit a timeout, evaluates policies (error status, latency threshold, or plain probability) against the whole trace, and only then decides what gets forwarded to storage. A pragmatic middle ground many teams land on: always keep traces with errors or high latency via tail sampling, and apply a low, cheap probabilistic rate to the large volume of unremarkable, fast, successful traces.
Where tracing sits next to metrics and logs
Tracing isn’t a replacement for the Prometheus-plus-Loki setup already doing the metrics and logs job — it’s the third leg, specifically good at showing causality and time distribution across service boundaries in a way neither of the others were designed for. Grafana Tempo is the natural open-source pairing here, and the useful glue between all three is exemplars — a link stored directly on a histogram data point pointing at a specific trace ID that contributed to it, so a spike on a latency graph can jump straight to one real trace that was part of causing it, rather than leaving you to go hunting for a representative example by hand.
The instrumentation mistake worth avoiding early
The failure mode on the other side of “traces are broken because context isn’t propagated” is over-instrumenting once tracing is working — creating a span for every function call, every loop iteration, every trivial internal step. This doesn’t make traces more useful, it makes the waterfall view unreadable and adds real overhead for no corresponding insight. The useful rule of thumb: a span should represent a boundary someone would actually want to reason about independently — a network call, a database query, a significant chunk of business logic — not every line of code that happens to take measurable time.