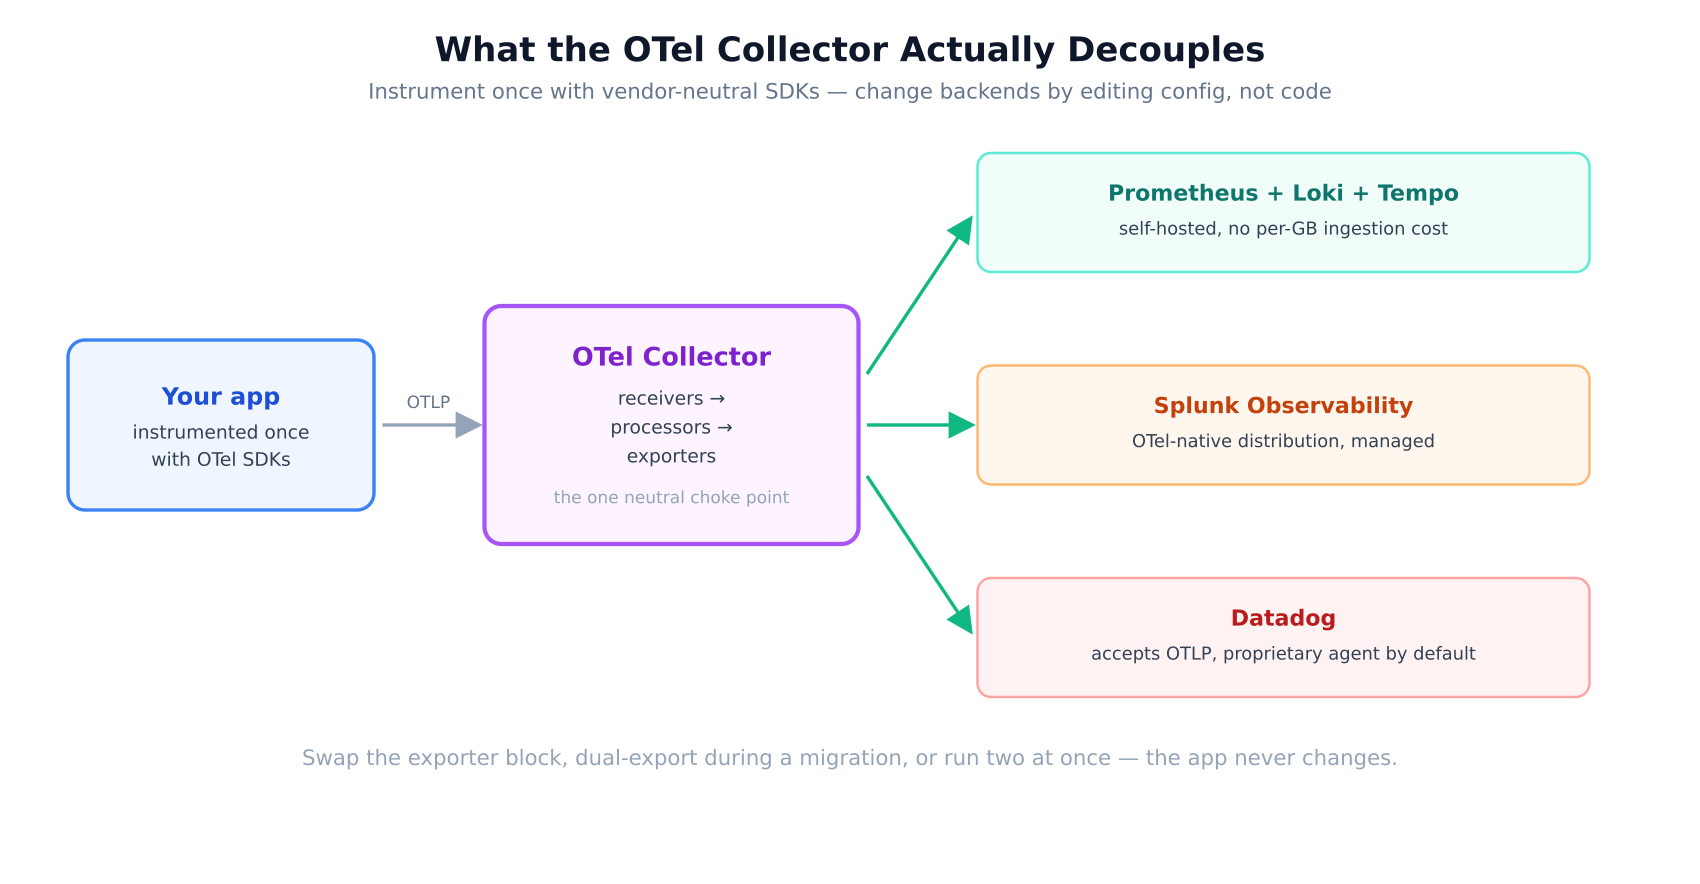
“Vendor lock-in” gets thrown around in observability conversations as if it’s one single problem. It isn’t. There’s instrumentation lock-in — your code is wired directly to a proprietary SDK or agent, and migrating means touching every service that emits telemetry — and there’s backend lock-in — your data lives in one vendor’s storage and query language, and migrating means rebuilding every dashboard and alert. OpenTelemetry only really solves the first one. Understanding that distinction is most of what you need to actually make this decision well.
What OpenTelemetry actually is
OpenTelemetry (OTel) is a CNCF project providing vendor-neutral SDKs for instrumenting code, a standard wire protocol (OTLP) for transmitting metrics, logs, and traces, and the Collector — a standalone process that receives telemetry, can process it (batch, filter, sample, redact, add labels), and export it to one or more backends. The point of all three pieces together is specific: instrument your application exactly once, and decide — or later change — where the data goes without touching that instrumentation again.
Where Splunk and Datadog actually sit relative to this
These two aren’t equivalent starting points, and it’s worth being specific rather than lumping “the vendors” together. Splunk’s OpenTelemetry Collector is, genuinely, a distribution built directly on the upstream open-source Collector — Splunk contributes components upstream and repackages the project with some additional integrations, rather than maintaining a parallel proprietary agent. Datadog’s Agent has historically been its own separate, proprietary piece of software, predating OTel’s maturity — though Datadog has since added OTLP ingestion support, meaning it can now receive data from a standard OTel pipeline even if its own default agent remains a distinct product with its own instrumentation libraries.
The practical takeaway: “open source vs. Datadog vs. Splunk” isn’t really a three-way fork at the instrumentation layer if you build on OTel from the start. It’s closer to a single decision — instrument with OTel — followed by a genuinely reversible choice of where the Collector sends the data, one that can include any of these options, simultaneously if you want, during a migration.
What you actually give up going fully open source
This is the part open-source advocacy tends to gloss over, and it’s worth being honest about, especially having spent a fair amount of this month personally dealing with what “self-hosted” actually costs in practice:
- Long-term storage isn’t free of engineering effort. Prometheus’s own TSDB isn’t designed for years of retention at scale — getting there means running Thanos, Cortex, or Mimir on top, which is real infrastructure to operate, not a checkbox.
- Operational burden lands on you. Every piece of the stack — collector, storage, dashboards — is now something your team patches, scales, and gets paged for at 2am. A managed vendor absorbs that; self-hosting explicitly does not.
- Some polish takes real engineering time to replicate. Automatic anomaly detection, deep code-level profiling integration, and cross-signal correlation UI are all things commercial platforms have invested heavily in — open source is closing the gap (Grafana’s own tooling, Pyroscope for profiling) but “closing the gap” is not the same as “already there” for every feature.
What you actually gain
- Cost that scales with your infrastructure, not your data volume. SaaS observability pricing is typically per-host or per-GB ingested, and telemetry volume tends to grow faster than most teams expect — a self-hosted stack’s cost is bounded by the compute you provision, not a metered bill that can surprise you.
- Data never leaves your boundary. For anything touching compliance requirements or genuinely sensitive logs, this isn’t a minor convenience — it’s sometimes the actual deciding factor, for the same reason it matters when deciding whether to send production logs to a third-party LLM API.
- No query-language or dashboard lock-in on the backend either. If your Collector already speaks OTLP, swapping Grafana Loki for a different log backend later is a config change to the exporter block, not a rewrite of how every service logs.
The pragmatic middle ground most teams actually land on
In practice, this rarely plays out as a clean either/or. A common, sensible pattern: instrument everything with OTel SDKs, run the Collector as your central pipeline, and export to a managed backend anyway — accepting the cost of a vendor for the operational relief, while deliberately retaining the option to redirect that export config to a self-hosted stack later without re-instrumenting a single service. The Collector’s own config also supports exporting to two backends simultaneously, which is exactly the mechanism that makes a real migration low-risk: run both in parallel, validate the new backend’s data and dashboards against the old one, then remove the old exporter once you trust it.
How to actually decide
The honest framing: this is a scarce-resource allocation question, not a philosophical one. At homelab or small-team scale, engineering time is usually cheaper than a metered SaaS bill relative to the value gained, and the operational ceiling of a self-hosted Prometheus/Loki/Grafana stack is well within reach without dedicated headcount — that’s the right call for most of what I run. At a scale where telemetry volume is large, uptime SLAs are contractual, and there’s no dedicated observability team to own the pipeline, the calculus flips — the vendor’s cost is the price of buying back engineering time that’s genuinely worth more elsewhere.
What OpenTelemetry actually removes from that decision is the worst version of it — being stuck with a bad backend choice because ripping out proprietary instrumentation from every service is too expensive to seriously consider. Whichever way you lean, instrumenting with OTel from day one is what keeps that decision reversible instead of permanent.