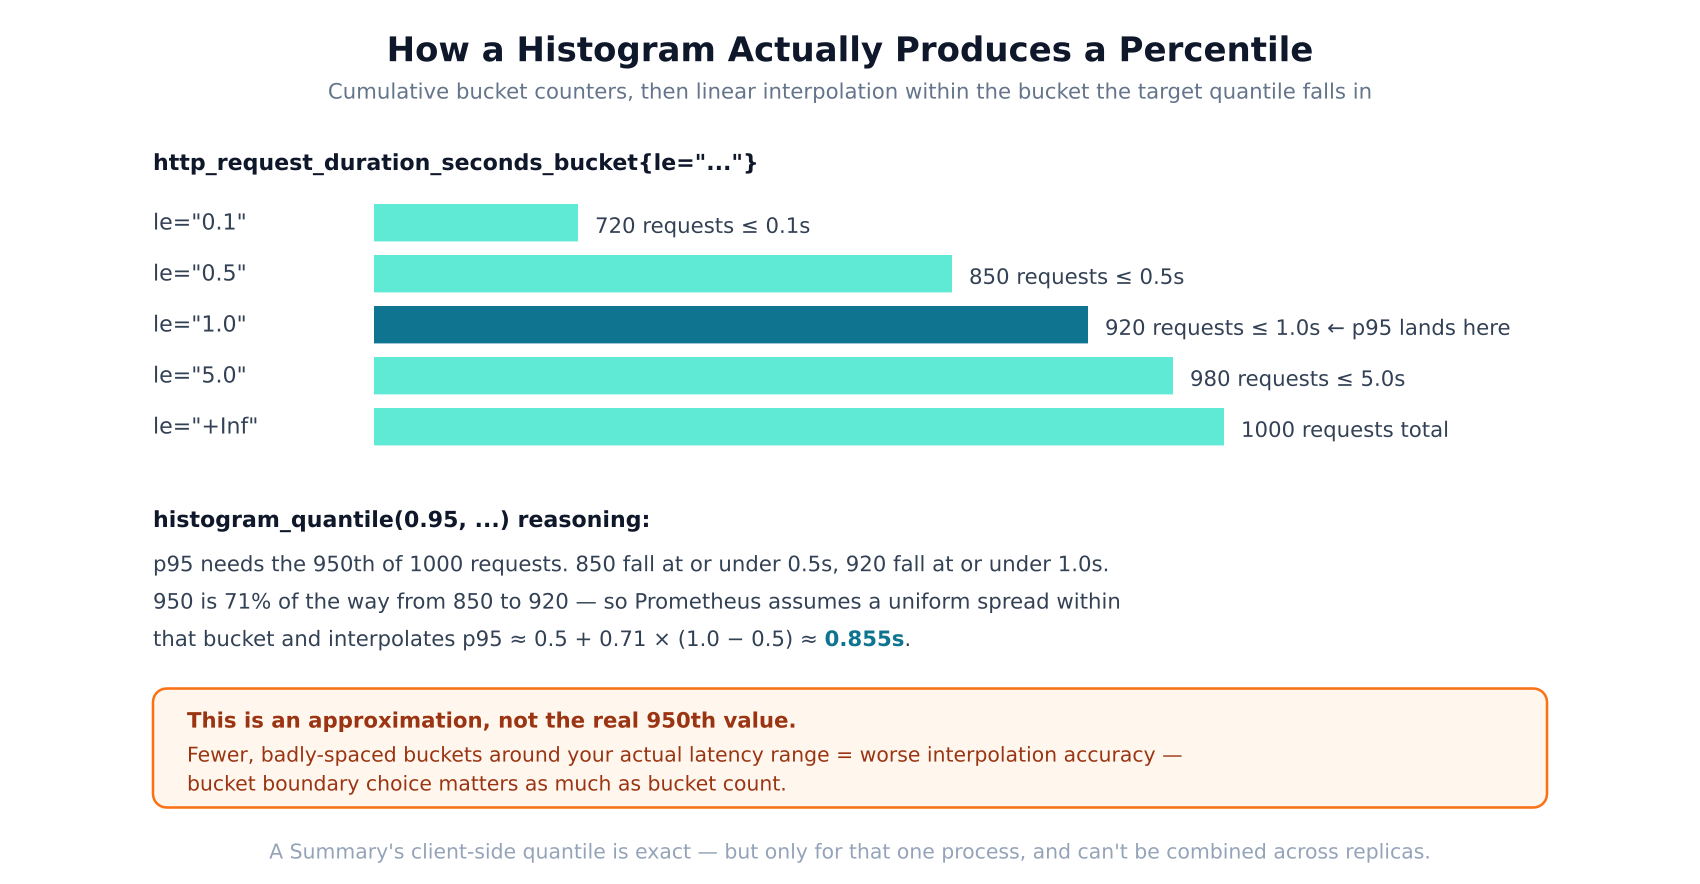
Every Prometheus metric is one of four types, and two of them — Counter and Gauge — are simple enough that most people get them right on instinct. The other two, Histogram and Summary, are where nearly every “why is…
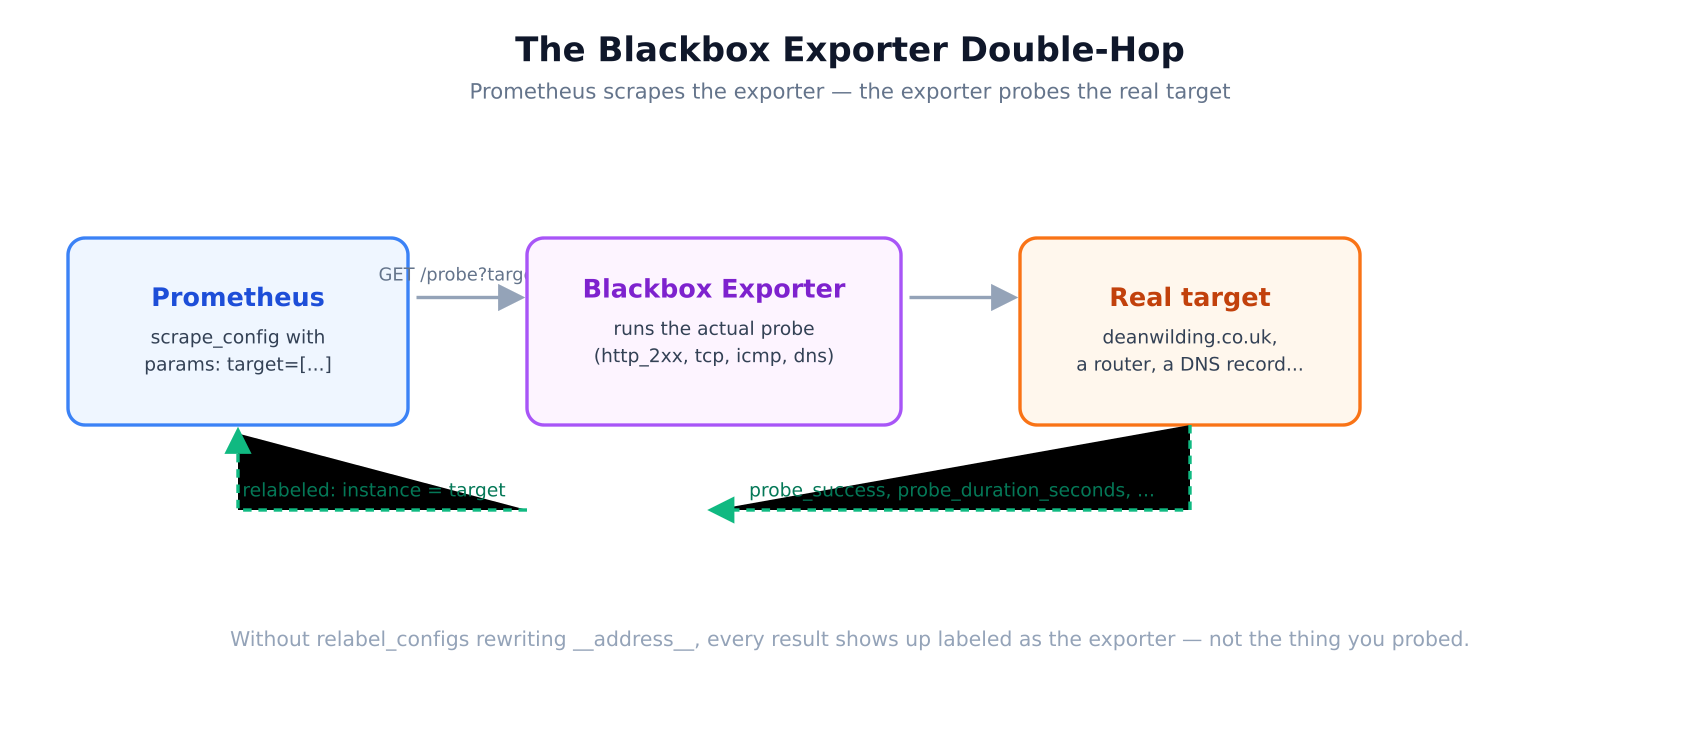
Blackbox Exporter and Custom Metrics: Monitoring What Your Other Tools Can’t See
Node Exporter will tell you CPU, memory, and disk are all fine. Apache’s access log will show clean 200s. And your site can still be unreachable — an expired cert, a DNS record pointing at the wrong IP after a…