Node Exporter will tell you CPU, memory, and disk are all fine. Apache’s access log will show clean 200s. And your site can still be unreachable — an expired cert, a DNS record pointing at the wrong IP after a migration, a firewall rule that quietly blocked port 443 from outside while everything internal kept working perfectly. Every metric you’re already collecting can look healthy at the exact moment nobody outside your network can actually reach anything. That gap is what the Blackbox Exporter exists to close.
White-box vs. black-box, in one sentence
Node Exporter and application-level metrics are white-box — instrumentation from inside the system, measuring what it thinks it’s doing. Blackbox Exporter is black-box — it probes a target from the outside, the same way an actual visitor or an actual DNS resolver would, with no knowledge of or access to the target’s internals. Both matter. Only one of them tells you what your users are actually experiencing.
What it can actually probe
Blackbox Exporter ships with a handful of probe modules, configured in blackbox.yml:
- http_2xx / http_post_2xx — HTTP(S) requests, checking status code, optionally a regex match against the response body, and — genuinely useful, easy to forget — TLS certificate expiry.
- tcp_connect — can a TCP connection even be established on a given port. Good for anything that isn’t HTTP: a database port, an SSH port from an external vantage point, a VPN endpoint.
- icmp — plain ping. Useful for basic reachability of network gear that doesn’t speak HTTP or SNMP at all.
- dns — resolves a record and checks it matches what’s expected. This is the one that catches “the record still points at the old IP after a migration” before a human notices.
A minimal module definition for checking a site is up, responding 200, and not about to have its certificate expire:
modules:
  http_2xx:
    prober: http
    timeout: 5s
    http:
      valid_status_codes: [200]
      method: GET
      fail_if_ssl: false
      fail_if_not_ssl: true
The part that actually trips people up: scrape config
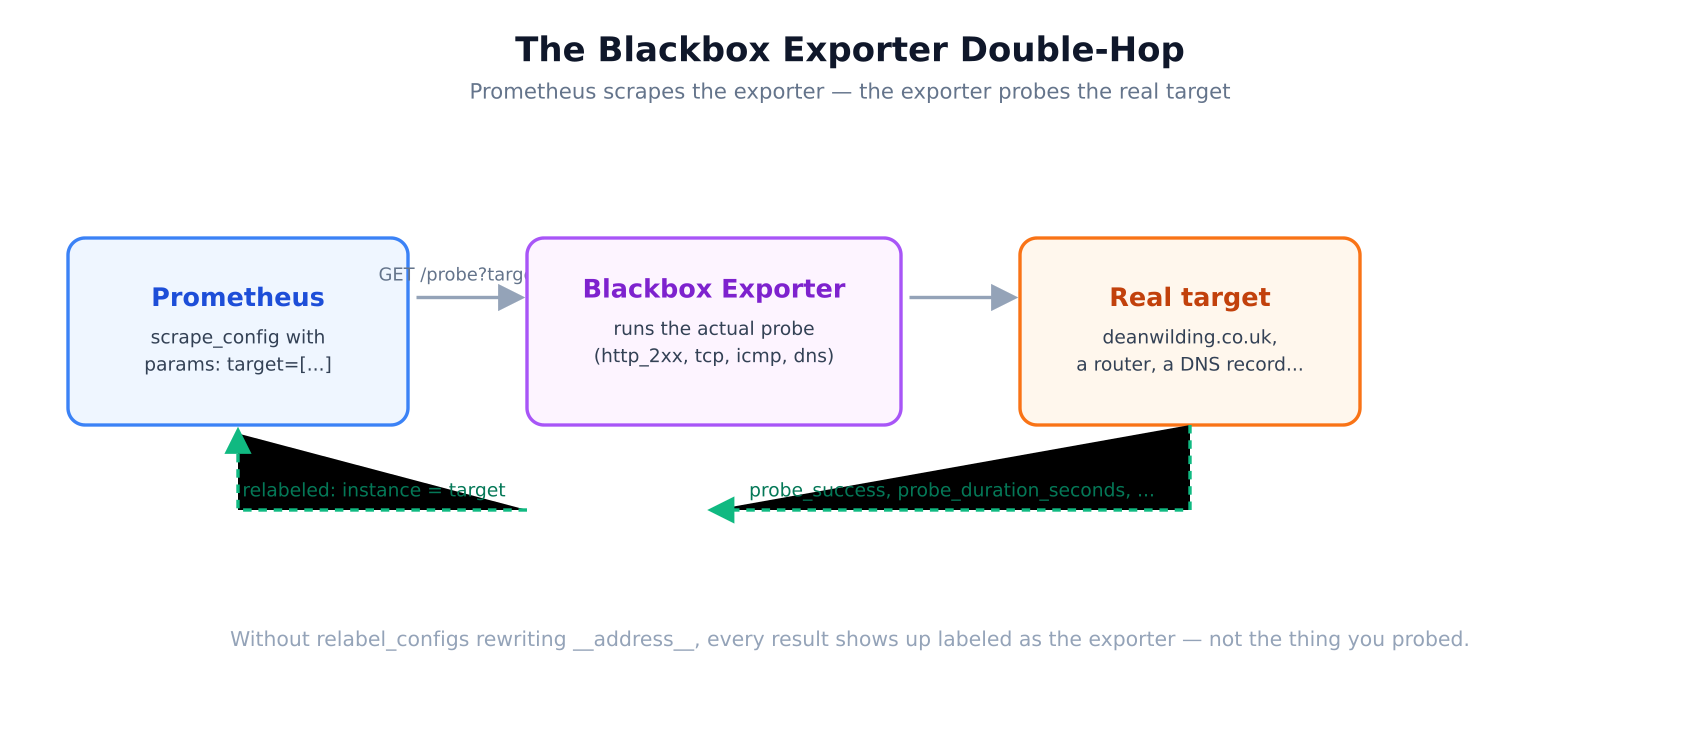
Blackbox Exporter doesn’t work like a normal exporter that reports metrics about itself. Prometheus has to scrape it with the actual target passed as a query parameter, and the exporter runs the probe against that target on demand, returning the result as if it were the exporter’s own metrics. Handled naively, every result in Prometheus ends up labelled as the exporter’s own hostname — not the thing you actually probed — which makes the data close to useless once you have more than one target.
The fix is a specific, slightly unintuitive relabeling block that every working Blackbox setup includes in some form:
scrape_configs:
  - job_name: 'blackbox_http'
    metrics_path: /probe
    params:
      module: [http_2xx]
    static_configs:
      - targets:
          - https://deanwilding.co.uk
          - https://grafana.example.internal
    relabel_configs:
      - source_labels: [__address__]
        target_label: __param_target
      - source_labels: [__param_target]
        target_label: instance
      - target_label: __address__
        replacement: 127.0.0.1:9115  # the blackbox exporter itself
Read bottom to top, conceptually: the address Prometheus actually connects to gets rewritten to point at the exporter. The original target — what you actually wanted probed — gets preserved first as __param_target (which becomes the actual ?target= query string parameter sent to the exporter), then copied into the instance label so your dashboards and alerts show the real target’s name, not the exporter’s.
Alerting on the useful metrics
Three metrics do most of the work: probe_success (1 or 0 — the whole point), probe_duration_seconds (how long the probe itself took — a slow-but-succeeding probe is often an early warning), and probe_ssl_earliest_cert_expiry — a Unix timestamp you can alert on with something like (probe_ssl_earliest_cert_expiry - time()) / 86400 < 14, catching an expiring certificate two weeks out instead of finding out from a browser warning page.
Custom metrics: the textfile collector
Blackbox and Node Exporter cover generic, reusable checks. Neither of them will ever know that your backup job is supposed to run at 3am, or that a specific batch process should finish within an hour. For anything specific to your own systems, Node Exporter’s textfile collector is the simplest on-ramp: point it at a directory (--collector.textfile.directory=/var/lib/node_exporter/textfile_collector), and any .prom file dropped there — in plain Prometheus exposition format — gets picked up and exposed alongside the normal host metrics.
A concrete example: recording when a backup last completed successfully, from a cron job that already runs the backup itself.
#!/bin/bash
# runs at the end of the backup script, on success
TEXTFILE_DIR=/var/lib/node_exporter/textfile_collector
cat << EOF > "${TEXTFILE_DIR}/backup.prom.$$"
# HELP backup_last_success_timestamp_seconds Unix time of last successful backup
# TYPE backup_last_success_timestamp_seconds gauge
backup_last_success_timestamp_seconds $(date +%s)
EOF
mv "${TEXTFILE_DIR}/backup.prom.$$" "${TEXTFILE_DIR}/backup.prom"
The write-to-temp-then-mv pattern isn’t decoration — it matters. The textfile collector can scrape mid-write if a script writes the file in place, reading a truncated or malformed result. A rename is atomic at the filesystem level, so the collector only ever sees a complete file. With that metric in place, an alert as simple as (time() - backup_last_success_timestamp_seconds) > 90000 — no successful backup in the last 25 hours — catches a silently failing backup job in exactly the way a green “process is running” dashboard never could.
Custom metrics: a proper exporter
For anything that needs to update more often than a cron job’s cadence, or that needs more than a single gauge value, a small dedicated exporter using a Prometheus client library is just as accessible. In Python:
from prometheus_client import start_http_server, Gauge
import time

queue_depth = Gauge('mail_queue_depth', 'Messages currently queued')

def check_queue():
    # however you actually get this number
    return int(open('/proc/net/some_queue_stat').read().strip())

if __name__ == '__main__':
    start_http_server(9200)
    while True:
        queue_depth.set(check_queue())
        time.sleep(15)
Add it as its own scrape target in prometheus.yml and it behaves exactly like any built-in exporter from that point on — same relabeling rules apply if you need them, same alerting rules, same dashboards.
Where each piece actually fits
Node Exporter answers “is the box healthy.” Blackbox Exporter answers “can the outside world actually reach what I think it can reach.” The textfile collector and custom exporters answer the question neither of those was ever going to know to ask — the specific, business-logic conditions unique to what you’re actually running. None of the three replaces the others; the gap between “the process is running” and “it works” is exactly the space all three, used together, are meant to cover.