Every few months a new device or app tells recreational runners the same thing: you’re training too hard, too often, and it’s quietly working against you. It sounds like clickbait, but it’s one of the more robustly supported claims in exercise physiology — and it hinges entirely on understanding heart rate zones properly, not just glancing at a number on a watch. This is the deep version: how zones are actually calculated, what’s physiologically happening in Zone 2 specifically, why the research on training intensity distribution is so consistent across elite endurance sports, and how to apply it without a lab.
Standard caveat: this is general exercise physiology, not personalised coaching or medical advice. Heart rate response varies by fitness level, medication, heat, hydration, and plenty else — if you have a cardiac condition or are new to structured training, get individual guidance before applying any of this.
Getting the zones right in the first place
Almost every zone-training mistake starts before a single run happens, with the formula used to define the zones. The ubiquitous 220 − age estimate for max heart rate is a linear regression from a 1970s study never intended as a precise individual predictor, and its actual standard error is around ±10–12 beats per minute — enough to shift someone from genuine Zone 2 into Zone 3 without them realising it. A field test (a hard, all-out effort of several minutes after a proper warm-up) or a formal lab test gets meaningfully closer than the formula ever will.
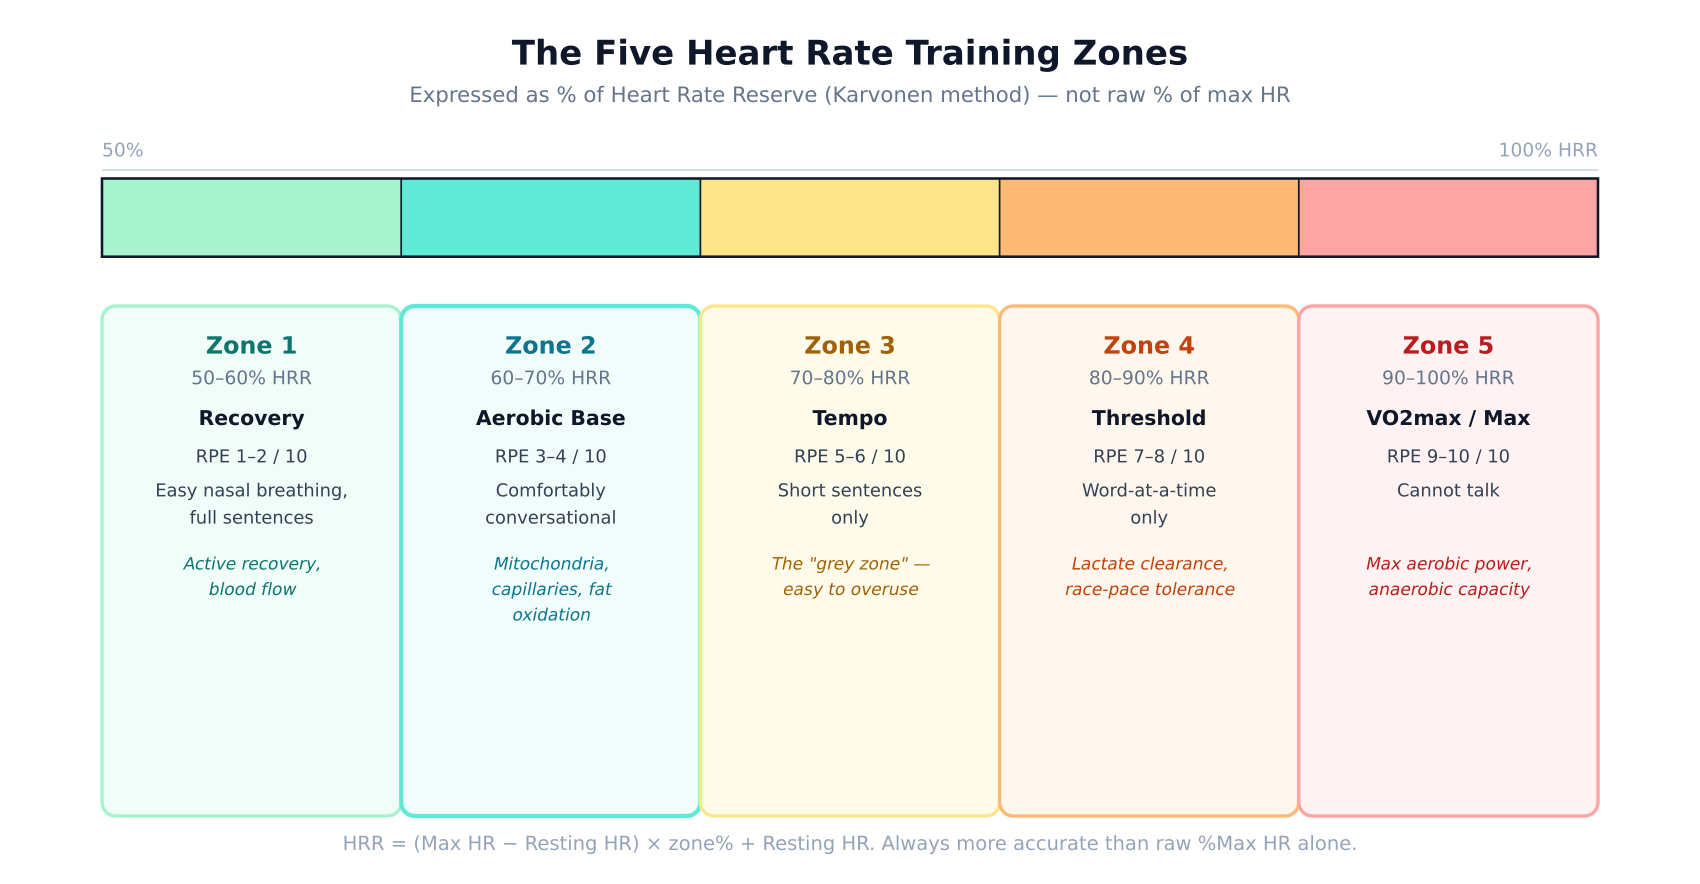
The second, more consequential mistake is calculating zones as a flat percentage of max heart rate rather than percentage of Heart Rate Reserve (the Karvonen method): Target HR = ((Max HR − Resting HR) × Zone%) + Resting HR. Resting heart rate reflects a real, individual physiological baseline — someone with a resting HR of 48 and someone with a resting HR of 70 do not have the same Zone 2 at the same %Max HR, because their reserve (the gap between resting and maximal) is different. HRR-based zones account for that; flat %Max HR zones don’t, and systematically misclassify fitter, lower-resting-HR individuals into zones that are actually harder than intended.
The gold standard, properly, is a lactate threshold test — measuring blood lactate at increasing intensities to find the specific points where lactate starts accumulating faster than it can be cleared (roughly corresponding to the Zone 2/3 boundary) and where it rises sharply (roughly the Zone 4/5 boundary). Heart rate zones are a practical proxy for these physiological thresholds, not the thresholds themselves — useful, but worth remembering they’re one layer removed from what actually matters.
What’s actually happening inside Zone 2
“Aerobic base” is a phrase thrown around often enough that it’s worth being specific about what it actually refers to physiologically. Sustained time at low intensity — roughly 60–70% of Heart Rate Reserve — drives a specific, well-documented set of adaptations that higher-intensity work does not produce nearly as efficiently:
- Mitochondrial biogenesis. Low-intensity, sustained effort is one of the strongest known stimuli for creating new mitochondria within slow-twitch (Type I) muscle fibres, and for increasing the density of oxidative enzymes within existing ones. More mitochondria, more capacity to produce energy aerobically before needing to lean on anaerobic pathways.
- Capillary density. Sustained low-intensity work stimulates angiogenesis — new capillary growth around trained muscle fibres — improving oxygen and substrate delivery directly to the tissue doing the work. This adaptation is slower to develop than mitochondrial changes, typically needing sustained months rather than weeks.
- Cardiac adaptation — specifically stroke volume. Sustained aerobic work at moderate heart rates, held for extended durations, is a strong stimulus for left ventricular adaptation — the heart’s chamber enlarging and its wall becoming more compliant, allowing more blood to be ejected per beat. A higher stroke volume means the same cardiac output at a lower heart rate, which is the actual mechanism behind the well-known “resting heart rate drops as you get fitter” effect.
- Fat oxidation efficiency. This is the one people cite most, and the one most commonly overstated. It isn’t that Zone 2 burns “more fat” as a percentage — that’s true, but slightly misleading. What matters more is the absolute rate.
The crossover concept — the actual argument for Zone 2
Exercise physiologists Brooks and Mercier described what’s now called the crossover concept: as exercise intensity rises from rest, the body’s fuel mix shifts progressively from fat toward carbohydrate. But the important, less-quoted detail is what happens to the fat oxidation rate specifically — not its percentage share, its actual grams-per-minute rate. It doesn’t rise all the way to maximum intensity. It rises from rest, peaks at a moderate intensity — for most trained individuals, somewhere in the Zone 2 range — and then declines at higher intensities, even though carbohydrate is now supplying the growing majority of total energy.
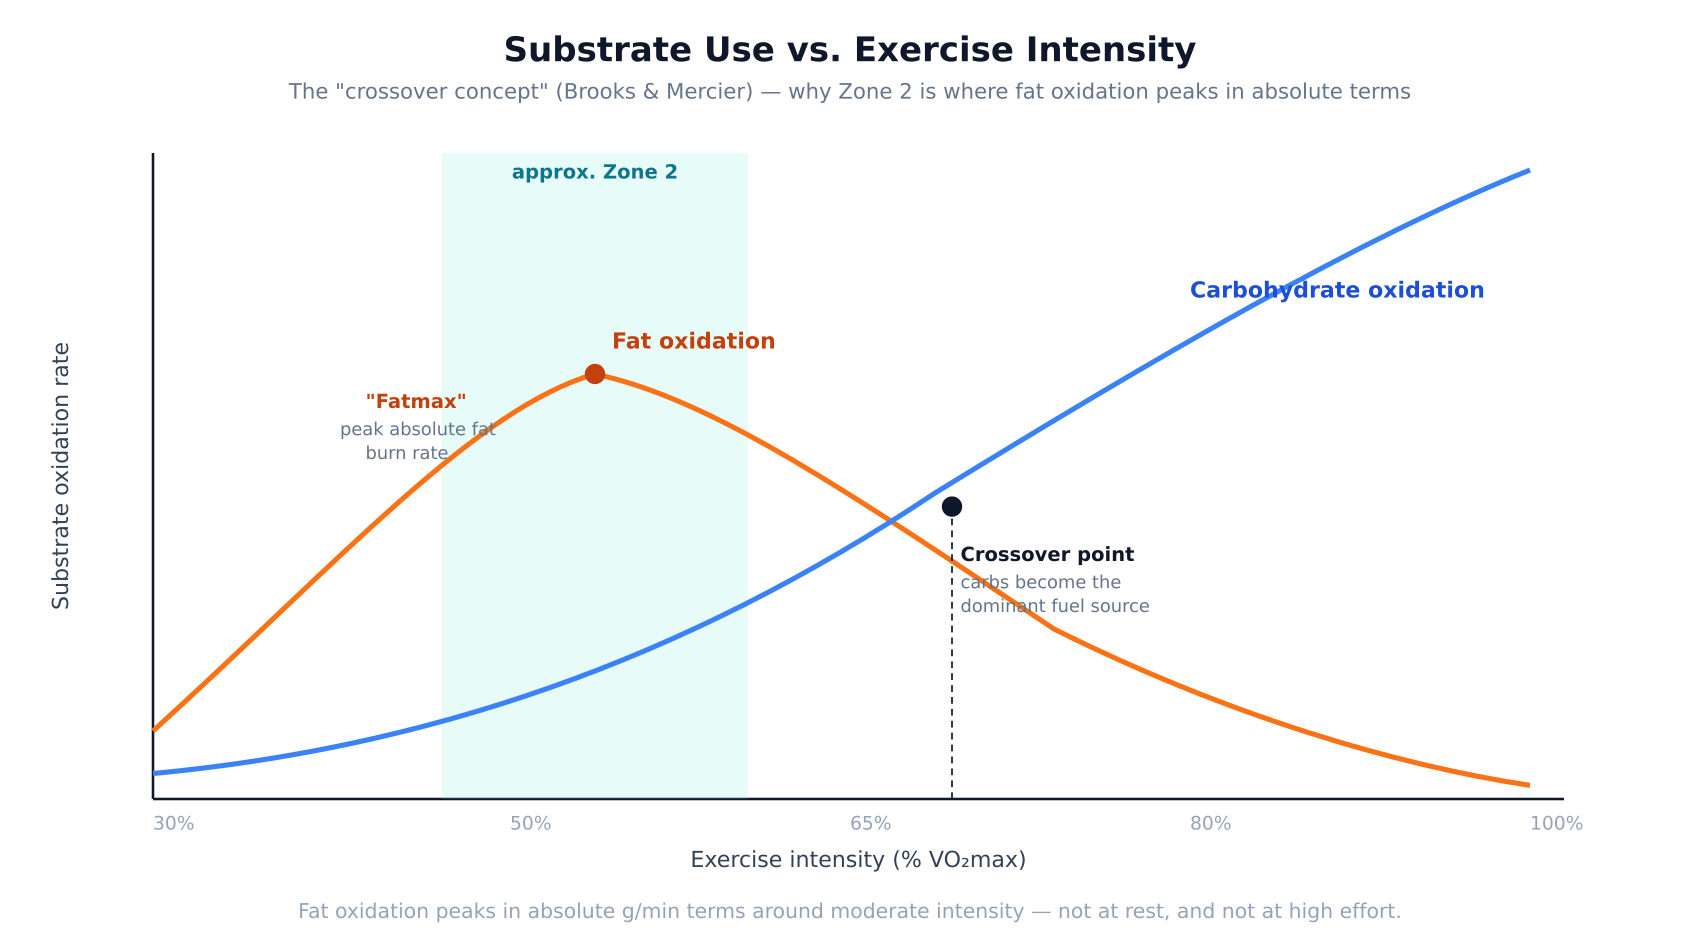
This is the actual mechanism behind “training your body to burn fat” — not that harder efforts are somehow bad for fat metabolism, but that there’s a specific, trainable intensity window where absolute fat oxidation is maximised, and consistently training in it shifts that window higher over time as mitochondrial density and enzyme activity improve. Training exclusively above that window doesn’t just fail to build this specific capacity as efficiently — it also depletes glycogen faster for a given duration, which matters directly for anyone doing sustained efforts where running out of stored carbohydrate is a real limiter.
The grey zone problem
None of this explains why Zone 2 should make up the majority of training volume rather than just a meaningful chunk of it. That argument comes from a separate body of research — most associated with sports scientist Stephen Seiler — looking at what elite endurance athletes across rowing, cycling, cross-country skiing, and distance running actually do, as measured, rather than what training theory says they should do.
The consistent finding is a polarized distribution: roughly 80% of total training volume at low intensity (Zone 1–2), a small amount — often under 10% — at moderate “tempo” intensity, and the remainder at genuinely hard intensity (Zone 4–5). Critically, very little time is spent in the moderate middle — the so-called grey zone — despite it being exactly where most recreational athletes, training by feel rather than by data, naturally gravitate. It feels productive: hard enough to feel like training, easy enough to feel sustainable. It’s also, per this research, the least efficient place to spend the bulk of your time, because it’s too hard to build the aerobic adaptations low intensity provides, and not hard enough to build the specific adaptations genuine high-intensity work provides.
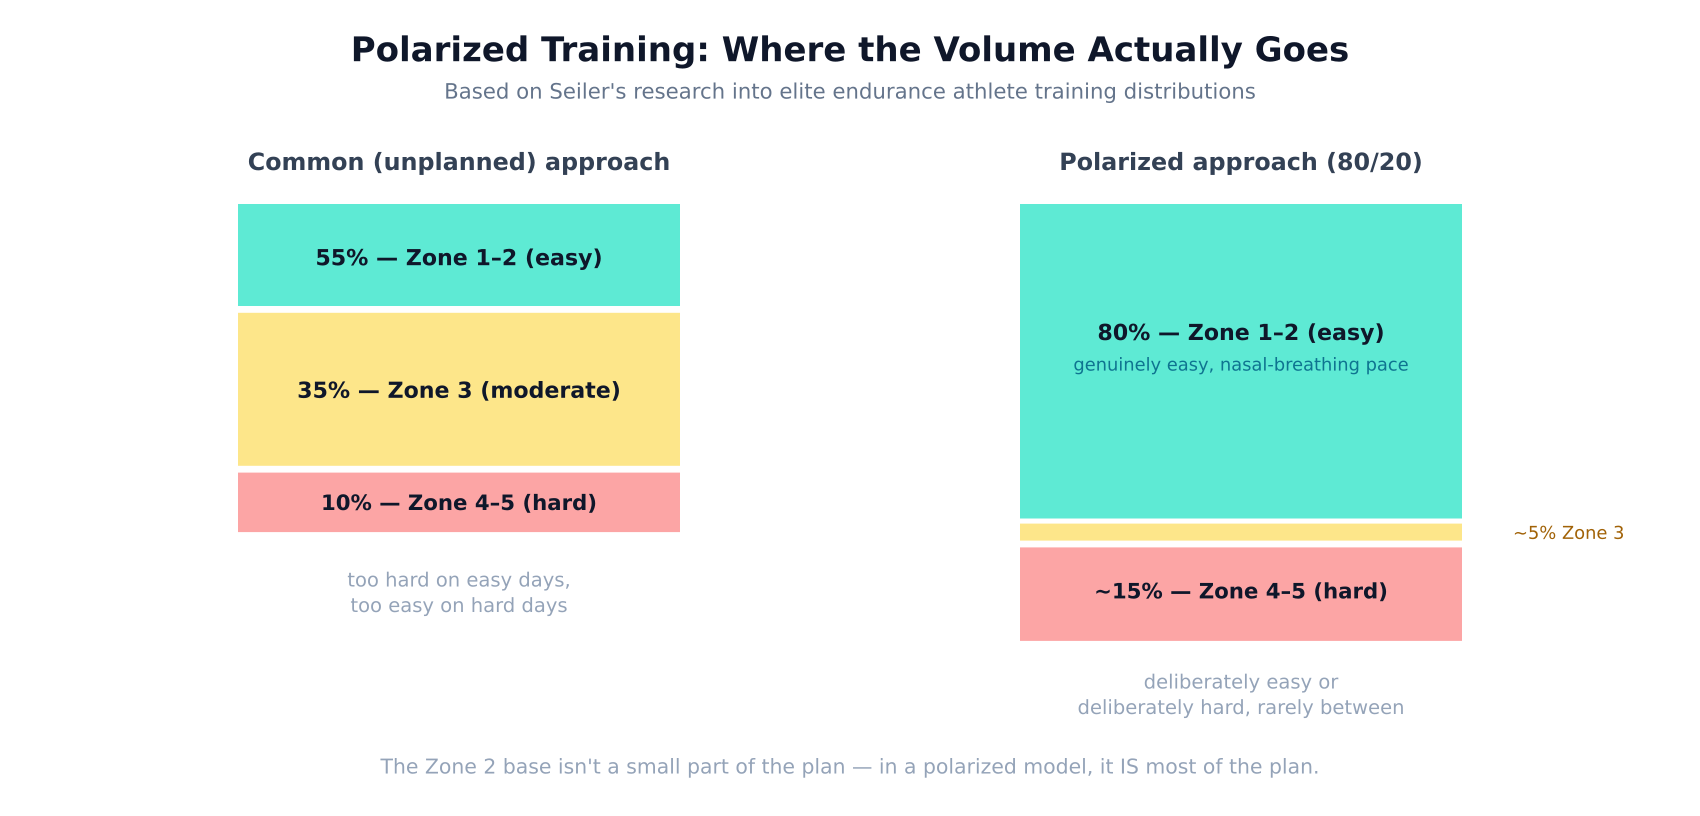
This is the actual, research-backed case for spending far more time than feels natural at low intensity: it isn’t that hard training is bad, it’s that hard training done well requires being genuinely recovered, and grey-zone volume quietly erodes that recovery capacity without providing either stimulus fully.
Applying this without a lab
A handful of practical methods get you most of the way to properly-calibrated Zone 2 training without formal lactate testing:
- The talk test. Genuine Zone 2 should allow full sentences without gasping. If you need to pause mid-sentence to breathe, you’re very likely in Zone 3 already, regardless of what your watch says.
- Nasal-only breathing. An intensity you can sustain while breathing only through your nose is, for most people, a reasonable proxy for the top of Zone 2 — it becomes physically difficult right around the point ventilation demands exceed what nasal breathing alone can supply.
- The MAF method (180 − age). Popularised by Phil Maffetone, this is a deliberately conservative estimate of the aerobic threshold, with adjustments for training history and health status. It’s blunter than a lactate test but considerably more accessible, and errs on the safe side of “too easy” rather than “too hard,” which is the direction most people need correcting toward anyway.
Two practical pitfalls worth naming explicitly. Cardiac drift: on a long steady effort, especially in heat or with inadequate hydration, heart rate climbs over time even at an unchanged pace, as the body diverts blood flow toward the skin for cooling and stroke volume gradually decreases. Training strictly by heart rate on a hot day without accounting for this means slowing down considerably to stay in zone — which is correct, not a sign anything’s wrong. And training by pace instead of heart rate in the early stages of base building: pace that felt like Zone 2 last season may now be Zone 3 as fitness changes, or vice versa after a break — heart rate reflects current physiological state in a way a fixed pace target never does.
How long this actually takes
The different adaptations above run on genuinely different timelines, which is worth knowing so expectations are set correctly. Mitochondrial enzyme activity begins responding within one to two weeks of consistent low-intensity volume. Capillary density changes take longer — meaningful adaptation over roughly two to three months of sustained training. Cardiac structural adaptation — the stroke volume changes behind a dropping resting heart rate — is the slowest, typically requiring several months to a year of consistent aerobic volume to fully manifest, and it’s also the adaptation most quickly lost with extended time off.
This is the actual reason “base building” is treated as a discrete, unglamorous phase in most structured training plans rather than something squeezed in around the interesting hard sessions: the adaptations that matter most for long-term capacity are also the slowest ones, and they need the recovery headroom that comes specifically from a training week where 80% of the volume isn’t asking very much of you at all.